
EneraX
Turn Energy Data Into
Actionable Business Decisions.
EneraX Energy Management Platform
More than a dashboard: energy data that management can act on.
Measured data. Better decisions.
8
Management questions answered
from one platform
6
Electrical diagnostics
included as standard
1 min
Data resolution
continuous interval metering
IPMVP
Option B/C aligned
baseline and savings verification
Built for Management
More Than an Energy Dashboard
EneraX is built to answer the questions senior management asks about energy — and to back each answer with metered data.
The Diagnostics
The Electrical Detail Behind Every Decision
Built on the Wiser Machines IoT EMS platform. Management sees the answers; engineers get the six diagnostics that produce them, included as standard rather than sold as a premium tier.
Product Walkthrough
Inside the EneraX Platform
Five screens, from the whole site down to a single circuit, the reconciled bill, the alert queue and the Scope 2 disclosure. Screens show sample data.
01 / 05
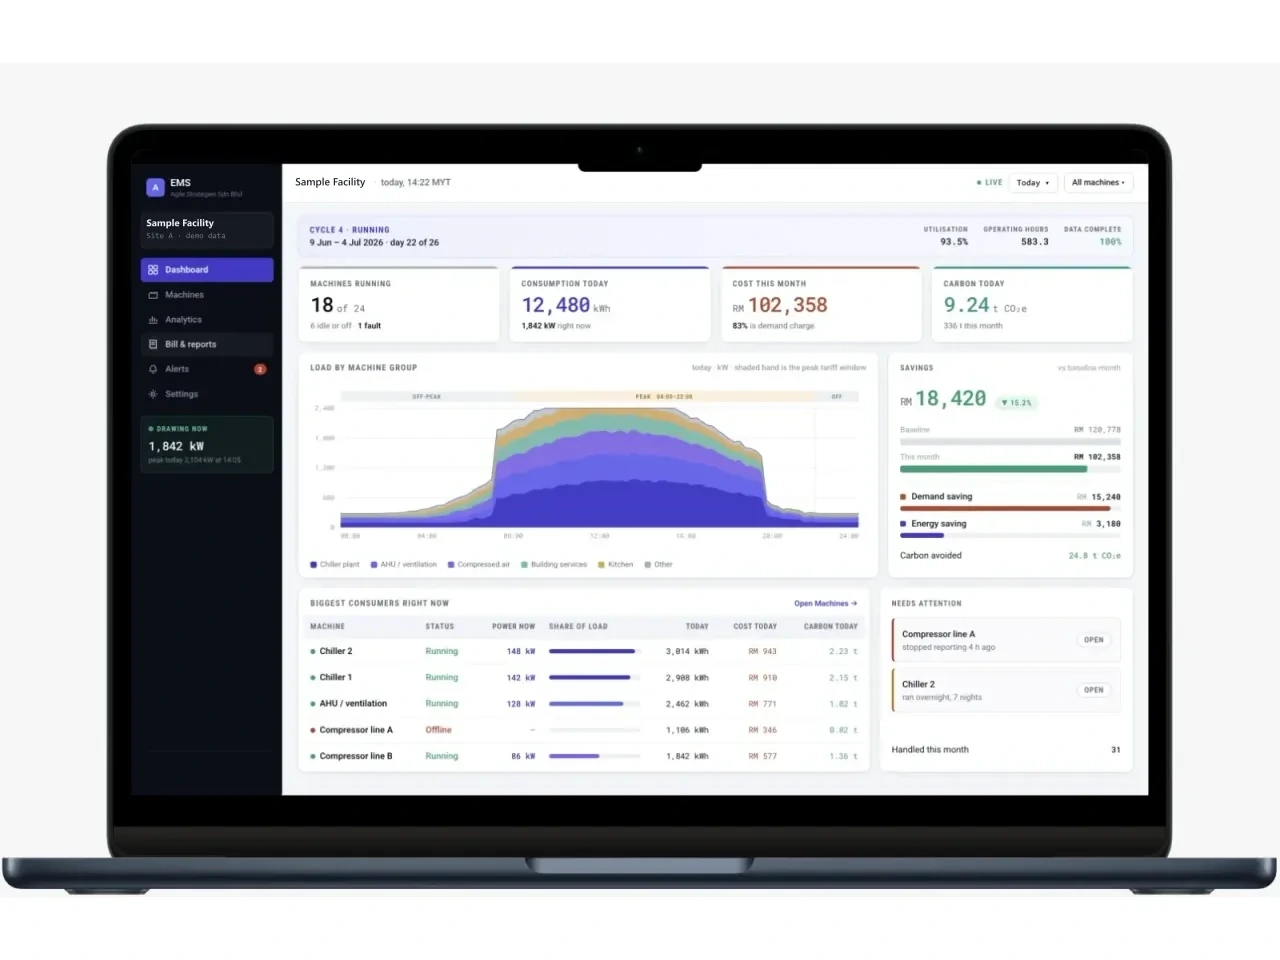
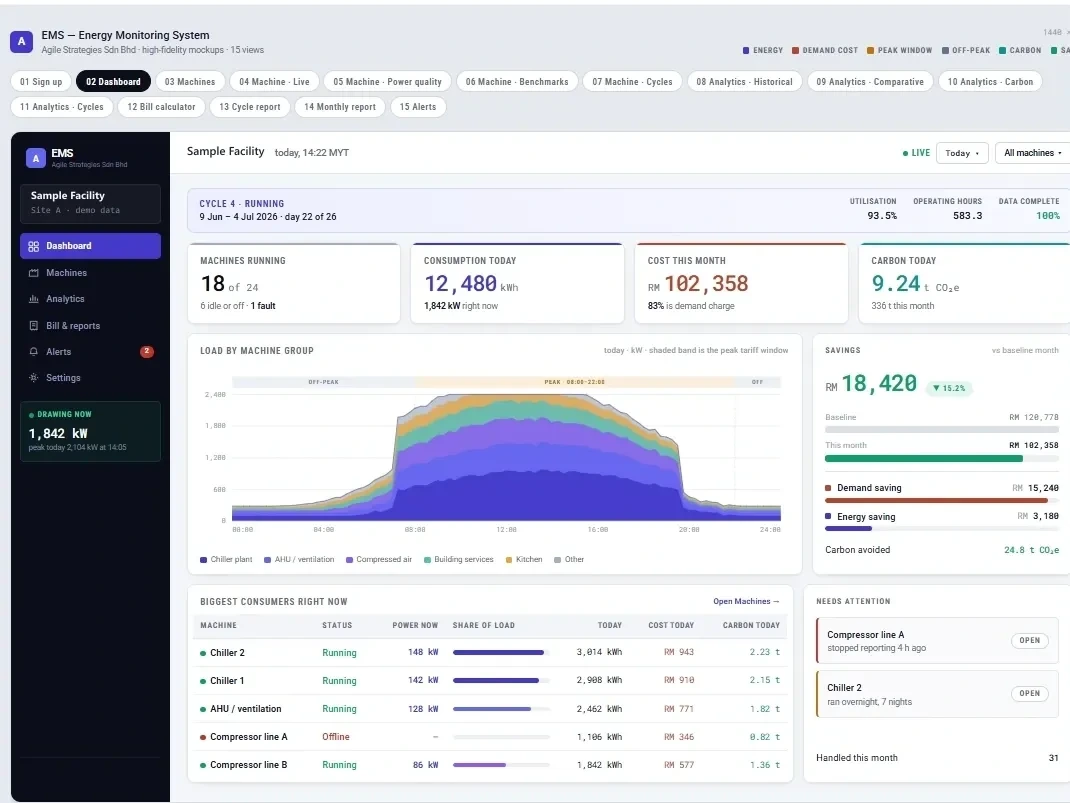
The Command Centre for a Site
One screen answers what the site is drawing right now, what it is costing, what it is emitting, and which machines need attention.
- Real-time load, with peak demand tracked against today's maximum
- Cost and carbon accrued so far today
- Savings against the baseline month, split by demand and energy
- Machines needing attention surfaced on the same screen
Load is broken down by machine group across the day, with the peak tariff window shaded so demand charges are visible rather than inferred at the end of the month.
Savings are shown against the baseline month, split into demand saving and energy saving, with carbon avoided alongside.
How it works
Load is broken down by machine group across the day, with the peak tariff window shaded so demand charges are visible rather than inferred at the end of the month.
Savings are shown against the baseline month, split into demand saving and energy saving, with carbon avoided alongside.
02 / 05
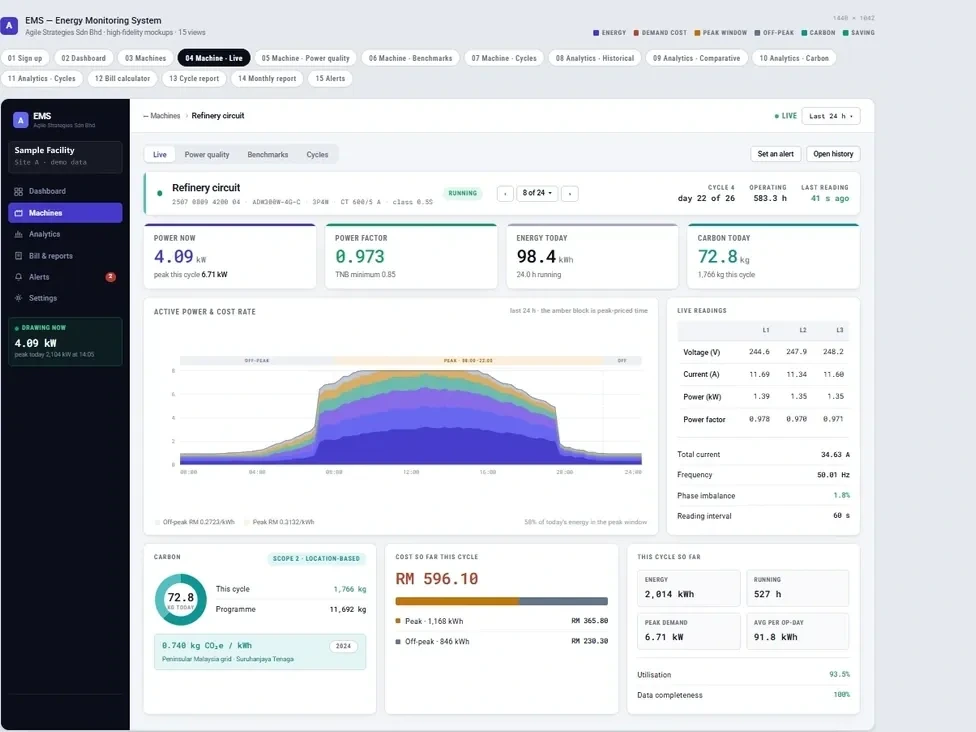
Drill Down to a Single Circuit
- Per-phase voltage, current and power factor
- Peak versus off-peak cost on the same circuit
- Location-based Scope 2 carbon per machine
- Cycle utilisation against operating hours
Every machine has its own view: live power, per-phase readings, cost rate at the current tariff, and location-based Scope 2 carbon for that circuit alone.
Peak and off-peak cost are separated, and cycle utilisation shows how much of the running time was productive.
How it works
Every machine has its own view: live power, per-phase readings, cost rate at the current tariff, and location-based Scope 2 carbon for that circuit alone.
Peak and off-peak cost are separated, and cycle utilisation shows how much of the running time was productive.
03 / 05
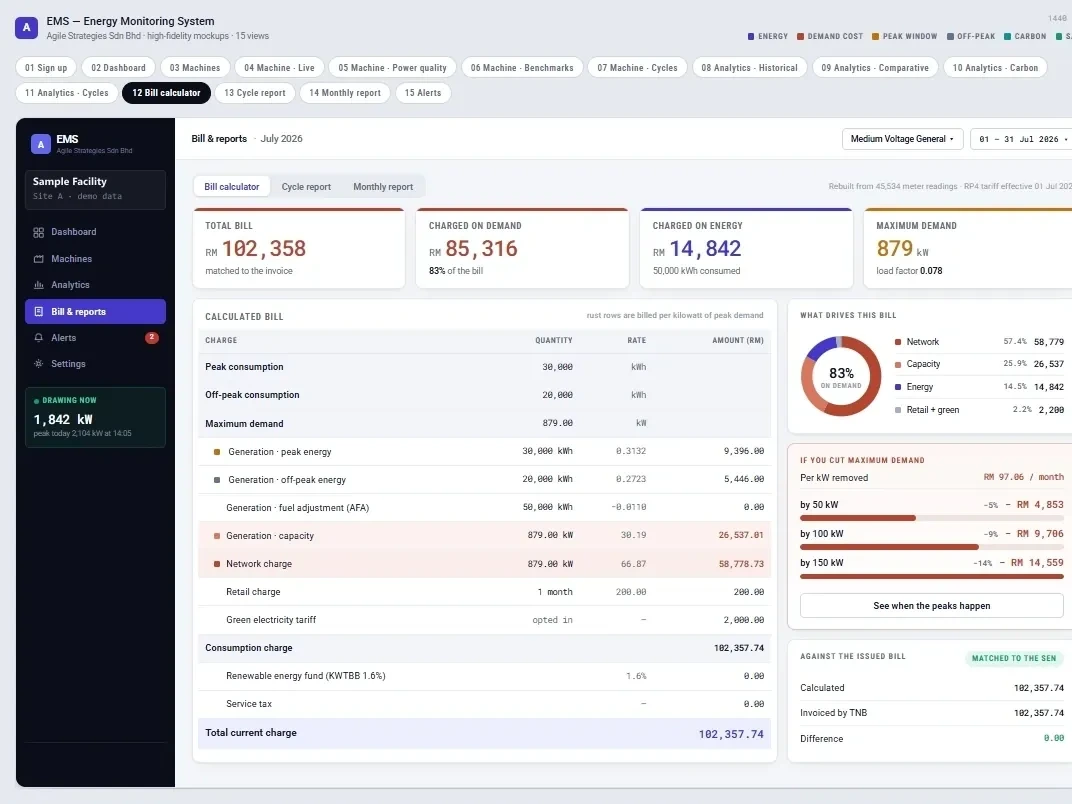
The Bill, Reconciled Against the Meter
- Calculated bill matched to the utility invoice
- Charge-by-component breakdown
- Maximum demand reduction scenarios
- Monthly management report exported as a PDF
The platform calculates the utility bill from metered data and matches it against the invoice, charge by charge, so a discrepancy is visible rather than absorbed.
The same figures feed the monthly board report, which exports as a PDF without anyone rebuilding it in a spreadsheet.
How it works
The platform calculates the utility bill from metered data and matches it against the invoice, charge by charge, so a discrepancy is visible rather than absorbed.
The same figures feed the monthly board report, which exports as a PDF without anyone rebuilding it in a spreadsheet.
04 / 05
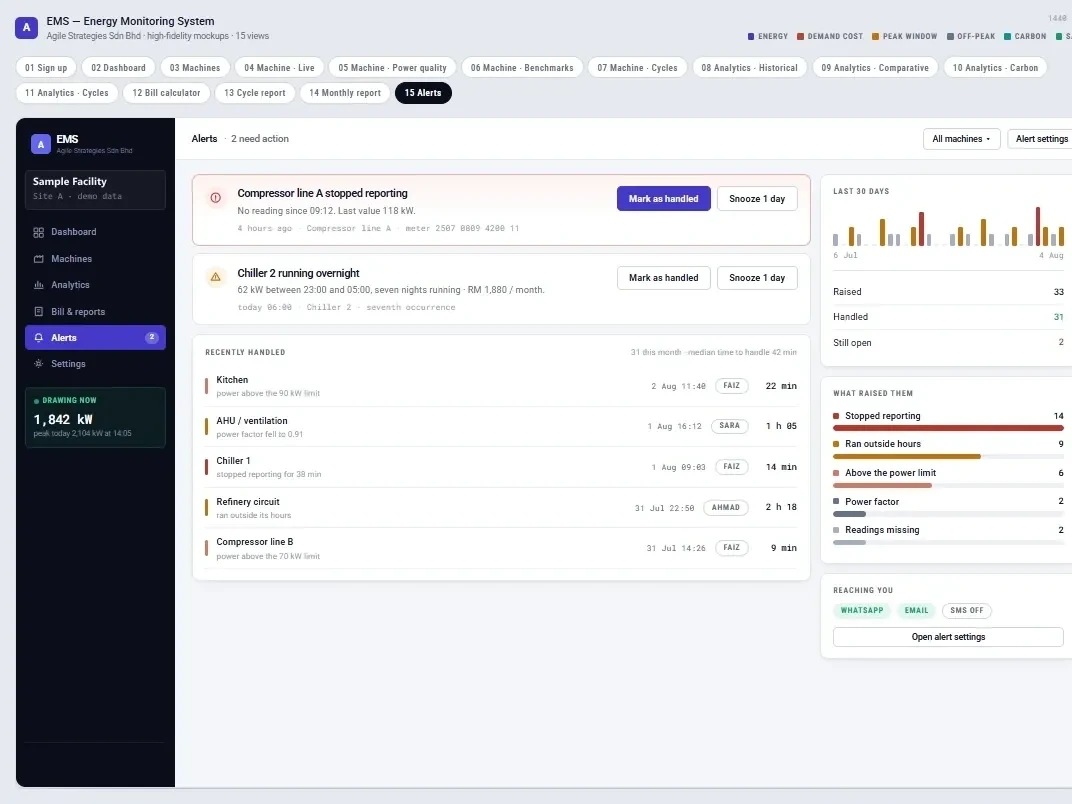
Alerts That Reach a Named Engineer
- Machine stopped reporting
- Machine ran outside scheduled hours
- Draw above the configured power limit
- Power factor drifting toward the surcharge threshold
An alert is only useful if someone acts on it. Alerts route to the engineer responsible for that circuit by WhatsApp or email, and the platform records how long each one took to handle.
The time taken to handle each alert is recorded, so management can see whether issues are being acted on.
How it works
An alert is only useful if someone acts on it. Alerts route to the engineer responsible for that circuit by WhatsApp or email, and the platform records how long each one took to handle.
The time taken to handle each alert is recorded, so management can see whether issues are being acted on.
05 / 05
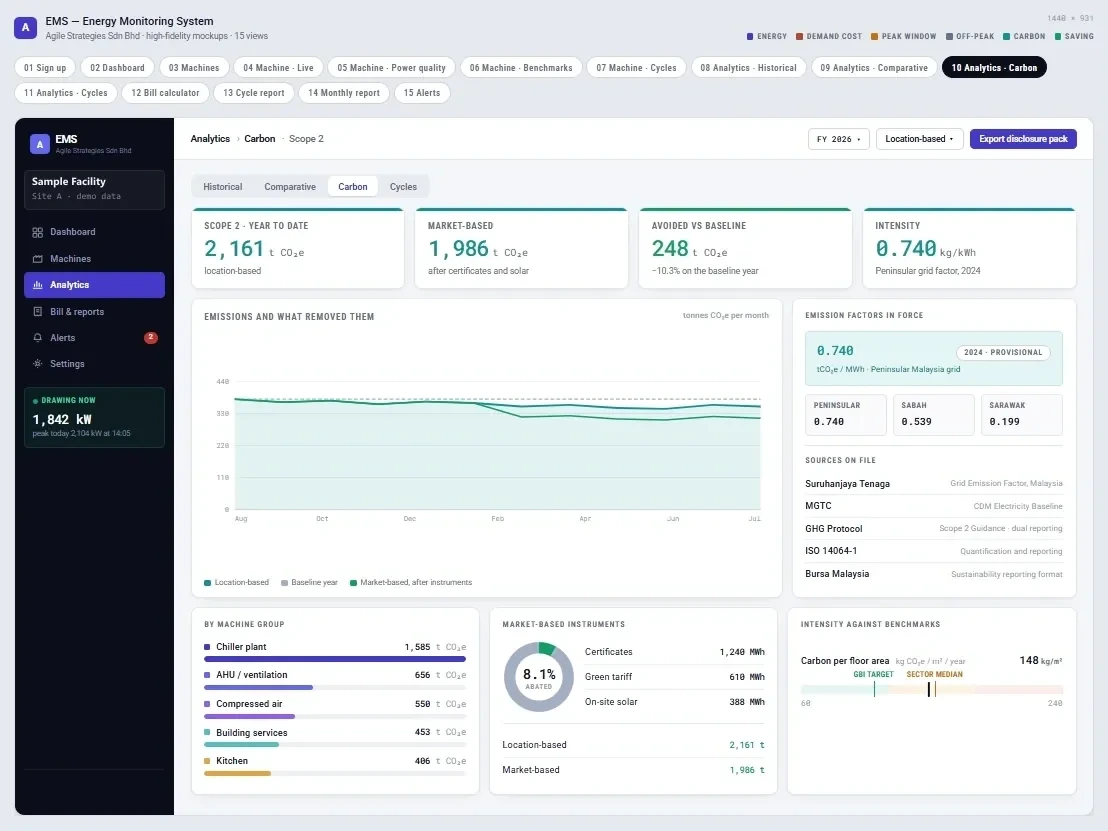
Scope 2 Disclosure, Straight From the Meter
- Location-based and market-based Scope 2
- Emission factors on file against every figure
- Benchmarked carbon intensity
- One-click disclosure pack export
Location-based and market-based Scope 2 are reported side by side, with the emission factors used held on file and shown against each figure.
Carbon intensity is benchmarked, and the disclosure pack exports in one action for the reporting cycle.
How it works
Location-based and market-based Scope 2 are reported side by side, with the emission factors used held on file and shown against each figure.
Carbon intensity is benchmarked, and the disclosure pack exports in one action for the reporting cycle.
- Real-time load, with peak demand tracked against today's maximum
- Cost and carbon accrued so far today
- Savings against the baseline month, split by demand and energy
- Machines needing attention surfaced on the same screen
Delivery Model
How the EMS Is Deployed
Four stages take a site from an unmeasured baseline to actively managed load.
01
Baseline
An energy study aligned with IPMVP Option B/C establishes the baseline.
02
Install
Monitoring is installed on the target circuits, with DVDC control added where it is justified.
03
Monitor
Continuous metered data streams power, quality and fault signals live.
04
Optimise
Management acts on the findings, and results are verified against the baseline.
Differentiation
Why This Matters to Management
Market Positioning
How This Compares Across the Market
A category-level comparison of how energy monitoring is typically delivered in Malaysia.
| Category | Global enterprise platforms | Malaysia / regional providers | Agile Strategies (EneraX) |
|---|---|---|---|
| Diagnostics depth | Portfolio analytics; power quality often a premium tier | kWh/kW standard; power factor and phase detail varies by vendor | Full diagnostics included — voltage, power factor, phase imbalance, faults |
| Control hardware | Monitoring layer; control via a separate BMS | Monitoring and alerting; overlay integration | Monitoring, with active control available (Whale Shark DVDC) |
| Local delivery | Regional system integrators | Malaysia / ASEAN-based teams | Johor Bahru and Kuala Lumpur based, on-the-ground delivery |
| M&V / verification | Portfolio analytics; formal M&V a separate scope | Dashboards; verified reporting varies | IPMVP Option B/C-aligned verification included |
| Regulatory alignment | Configurable to local standards | Built for EECA, TNB RP4/MD, ISO 50001 | Reporting aligned to EECA, SEDA, MGTC, Bursa NSRF / IFRS S2 |
Positioning is based on publicly available vendor information as of August 2026. It is a category-level comparison, not a feature-by-feature audit; confirm current specifications directly with each provider.
From a Live Deployment
What the Diagnostics Found on an Industrial Circuit
On a monitored three-phase circuit at an industrial facility, EneraX surfaced issues that a consumption total alone would have missed. Customer details and operating figures are withheld.
These findings illustrate the kind of information the platform produces. Results at other facilities will differ.
- Power factor running below the TNB 0.85 surcharge threshold during earlier production cycles, then corrected
- Phase imbalance tracked continuously, with one phase consistently carrying the highest load
- Voltage confirmed within the TNB permissible band throughout the monitoring period
- Shutdown episodes detected automatically and characterised by production cycle and restart pattern
Carbon Reporting
How Scope 2 Emissions Are Calculated
Scope 2 emissions are the indirect greenhouse gas emissions from purchased electricity. EneraX calculates them using the location-based method — electricity consumed in kWh multiplied by the grid emission factor in kgCO2e/kWh — the approach applied by the MGTC SME Carbon Footprint Calculator and commonly used for Bursa Malaysia NSRF and IFRS S2 Scope 2 disclosures.
Because the figure is derived from metered consumption rather than an estimate, the carbon number on a report can be traced back to the circuit and the interval that produced it.
Current Grid Emission Factors
| Grid region | GEF (kgCO2e/kWh) | Source |
|---|---|---|
| Peninsular Malaysia | 0.740 | Energy Commission (ST) / MGTC Calculator |
| Sabah | 0.539 | Energy Commission (ST) / MGTC Calculator |
| Sarawak | 0.199 | Sarawak Energy Bhd / MGTC Calculator |
Projects on the Peninsular grid use 0.740 kgCO2e/kWh unless a site-specific factor is supplied.
Regulatory Alignment
Reporting That Maps to Malaysian Obligations
The platform's reporting is structured around these Malaysian frameworks, so less has to be rebuilt by hand. Summaries only — obligations should be confirmed against the current regulations.
Where It Is Applied
Facilities That Use Energy Data
Energy monitoring experience across industrial, hospitality, retail, transport and healthcare facilities. Customer names are not published.

See Your Energy Clearly.
Talk to our team about establishing a baseline and verifying performance across your facility.