Our Experience
Technical Experience in
Real Operating Environments.
Energy technology in real facilities, presented without naming customers.
Real equipment. Real operating conditions.
Where We Have Worked
Facility Types in Our Experience
Our installations and energy assessments span the facility types where HVAC and motor loads drive a large share of energy cost.
Equipment Covered
Proven on Real Plant and Equipment
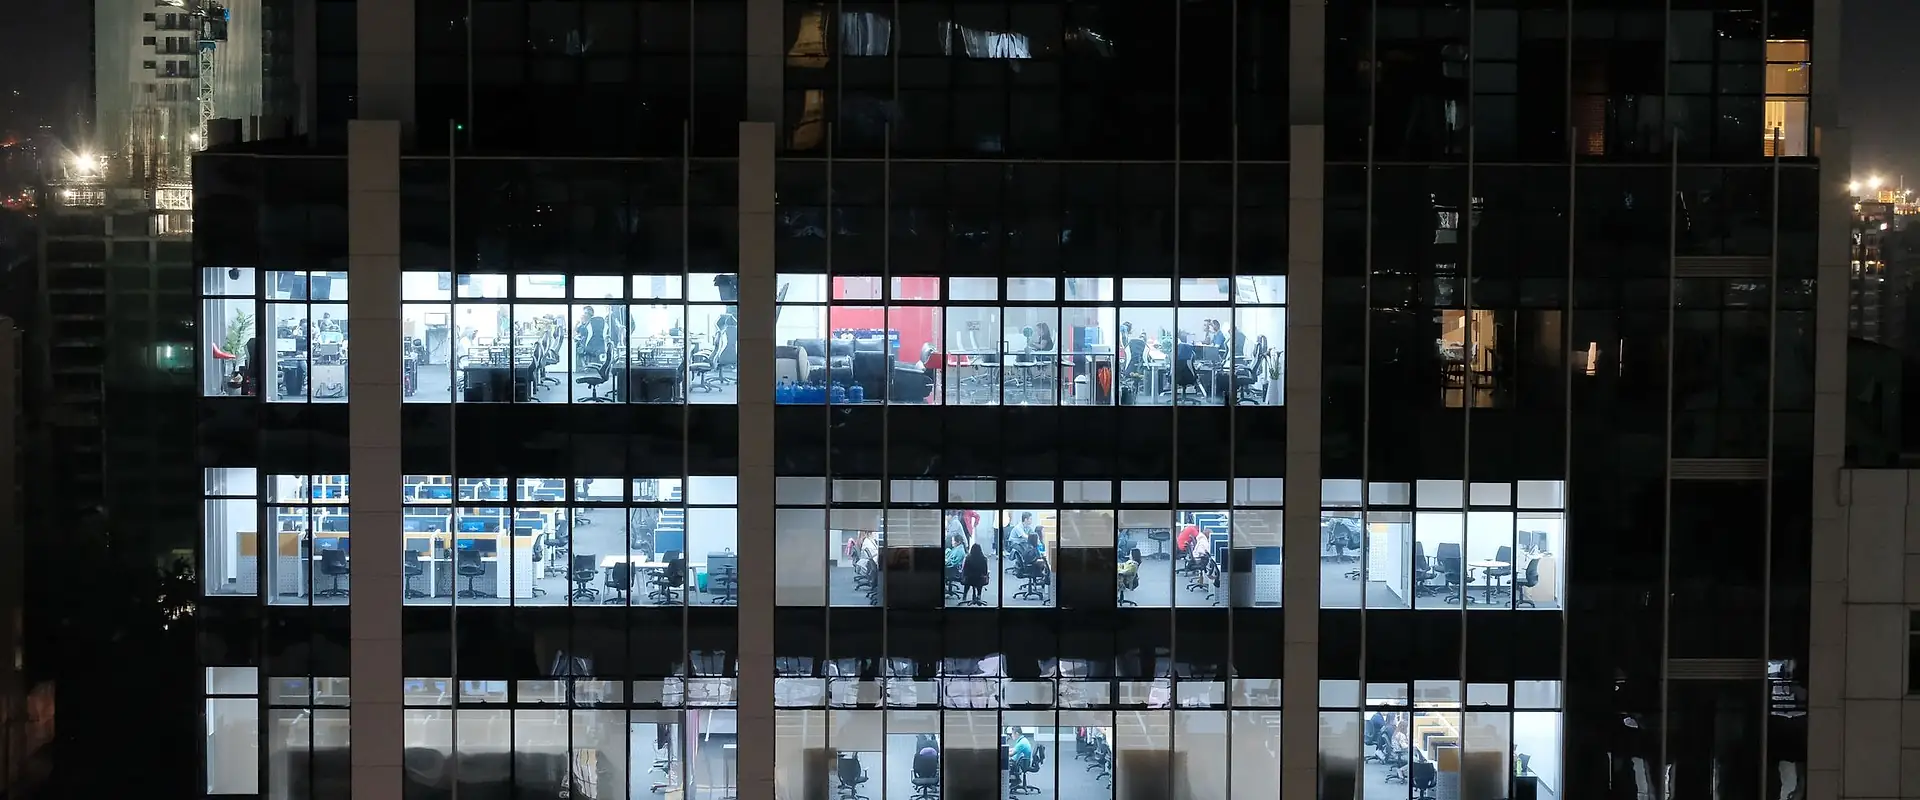
Across commercial buildings, hotels and resorts, shopping malls, hospitals, airports, industrial and institutional facilities, our experience covers the equipment that drives a facility's energy cost.
Performance
What Our Experience Shows
Results are presented as general ranges, with typical, recorded and independently tested figures kept separate.
30 – 50%
Typical expected energy savings
subject to application and operating conditions
Up to ~60%
Recorded savings range
based on selected installations
53.4 – 60.9%
Independent test results
controlled tests by SIRIM QAS International
~2 – 3 years
Typical payback
subject to site conditions and operating profile
Figures relate to HVAC motor applications such as air handling units, cooling towers, pumps and ventilation. Recorded results are presented as a general range without identifying customers, and some installations were pilot projects. Independent test results were obtained under controlled test conditions and do not represent the performance of every installation. Savings and payback at any facility depend on equipment type and condition, load profile, operating hours and electricity tariff.
Reading the Numbers
How to Read Our Performance Figures
Different figures come from different circumstances. This is what each one means.
| Figure | What it represents | How to read it |
|---|---|---|
| Typical expected savings: 30 – 50% | The range we expect for suitable HVAC motor applications | Subject to application and operating conditions. Confirmed for each facility during assessment. |
| Recorded savings: up to approximately 60% | Measured results from selected installations, presented as a general range | Customers are not identified. Some installations were pilot projects, and results at other sites will differ. |
| Independent test results: 53.4% and 60.92% | Two controlled tests by SIRIM QAS International, in 2020 and 2025 | Each result relates to the specific equipment and conditions tested. Not the expected result of every installation. |
| Typical payback: approximately 2 – 3 years | The expected period to recover the investment | Subject to site conditions, operating profile, operating hours and electricity tariff. |
No figure on this website is a guarantee of performance at a particular facility. Any performance commitment applies only where it is set out in a signed agreement.
In the Field
Installations and Dashboards
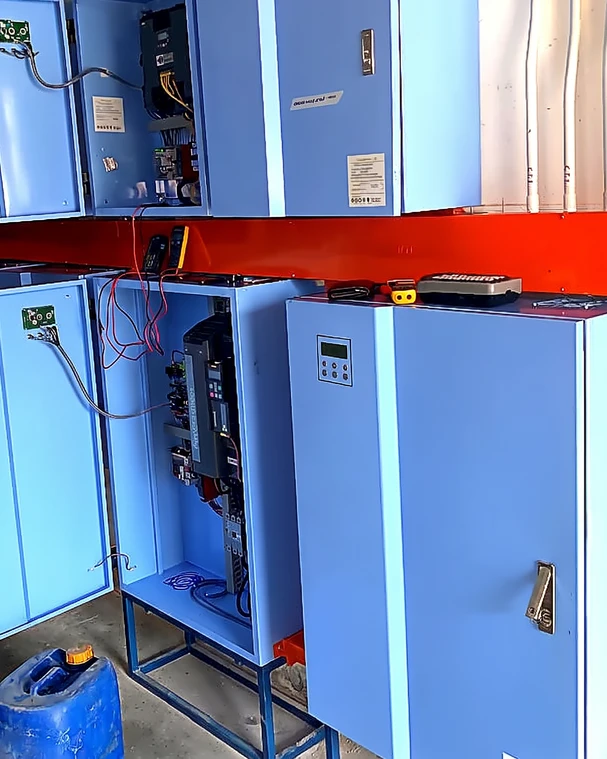
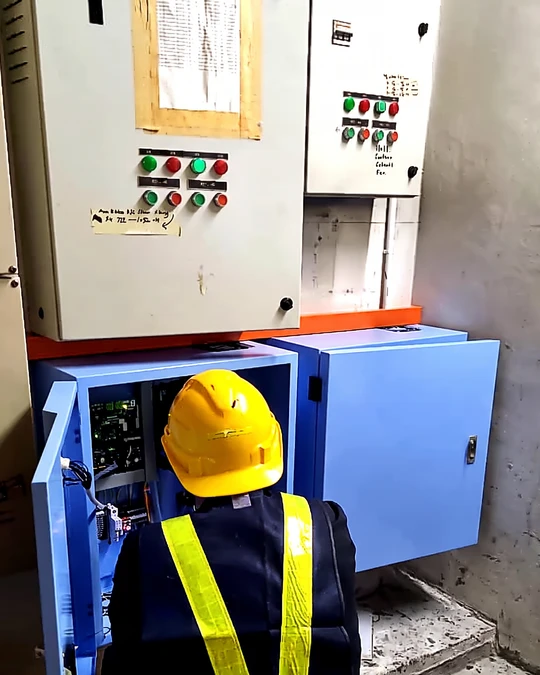
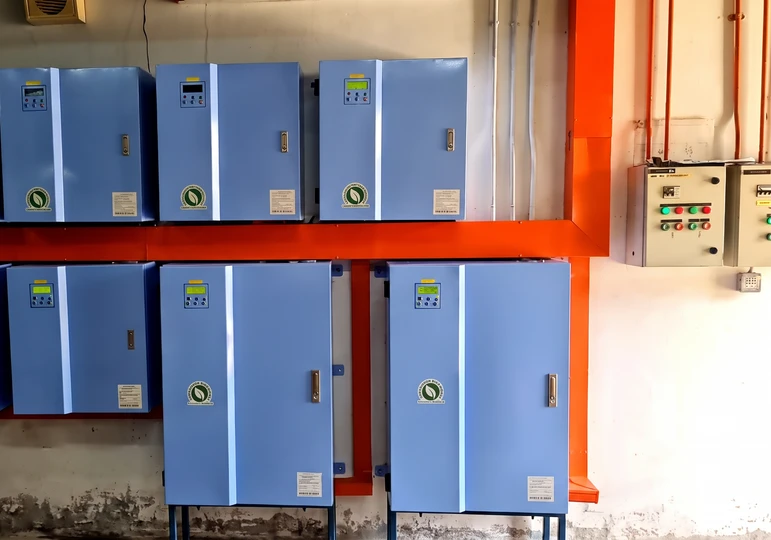
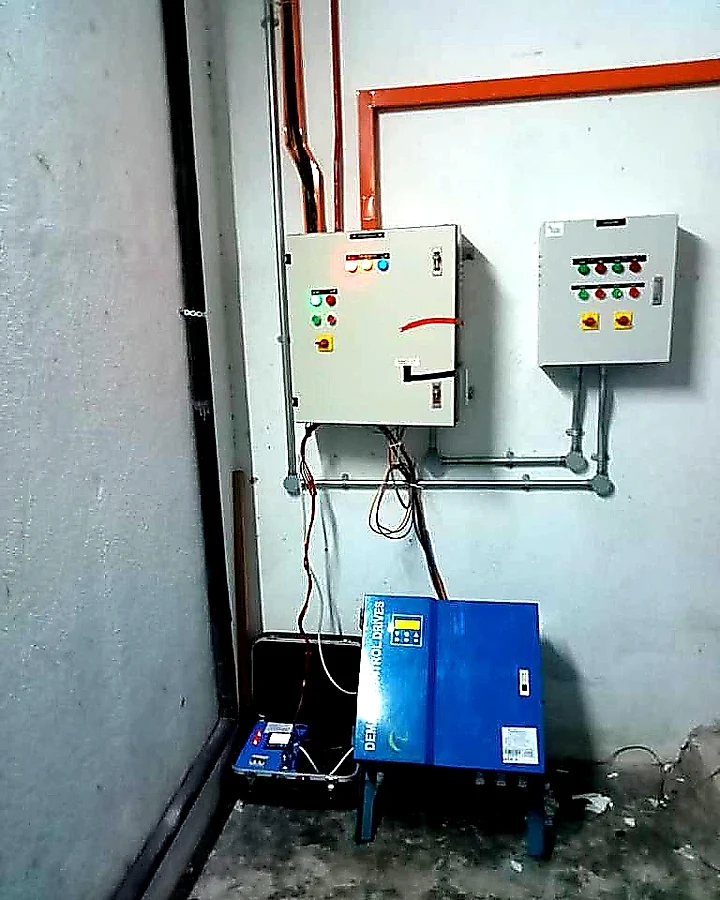
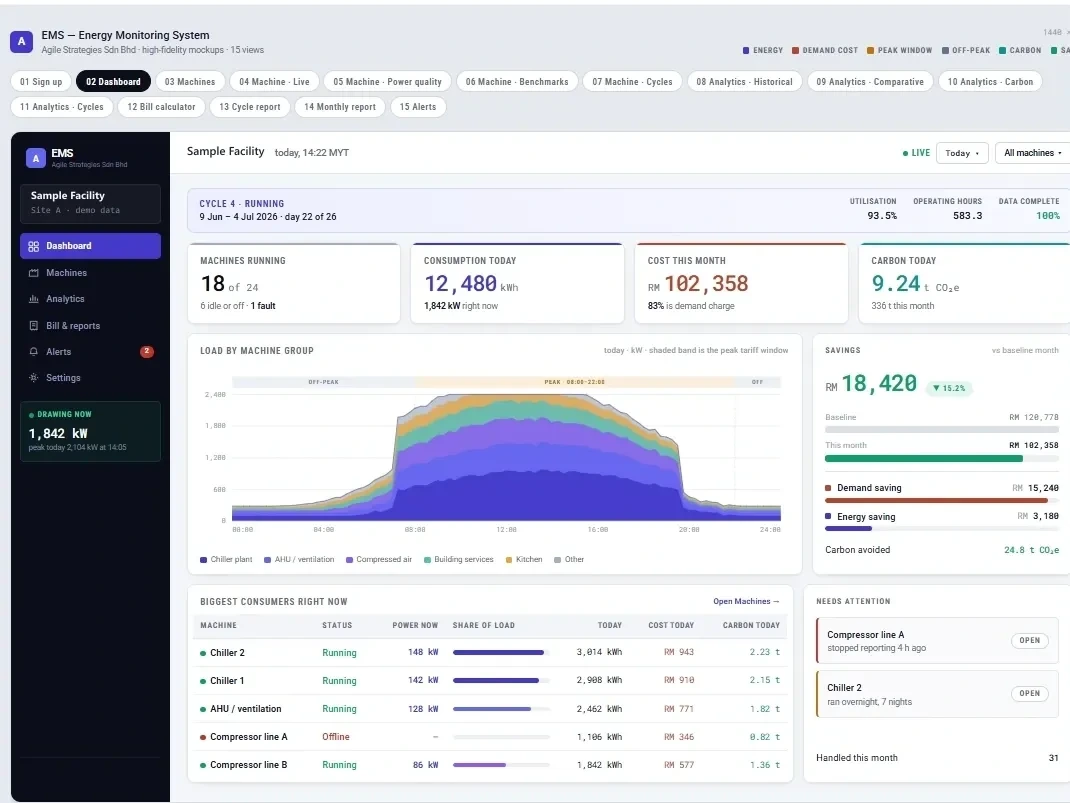
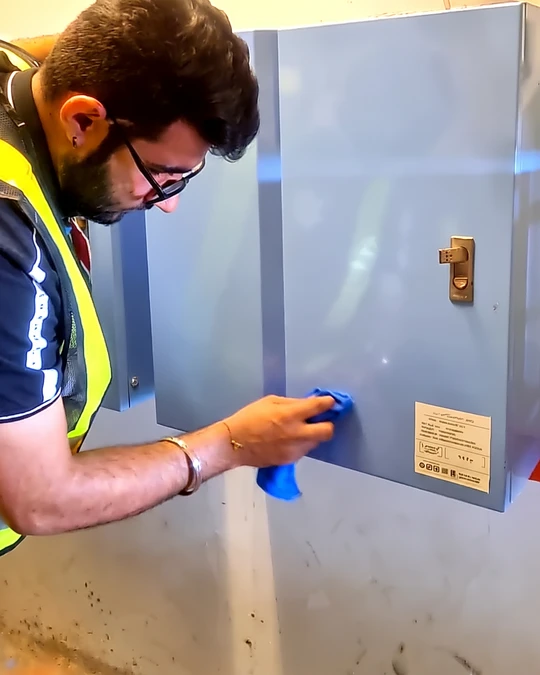
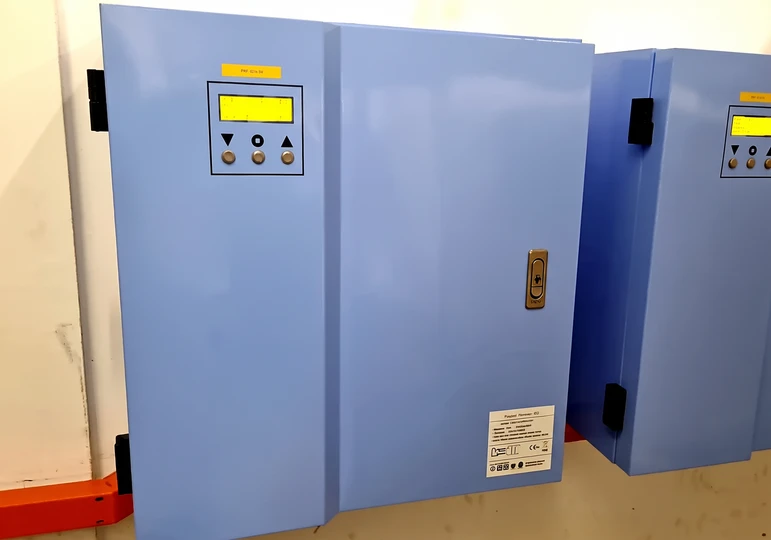
Our own photography of installed equipment and monitoring screens. Customer and site details are withheld.
Let's Talk About Your Facility.
Tell us about your equipment and operating profile, and we will help identify where the opportunity is.